Major US and European airlines will usually tinker with published schedules until about two months prior to departure, and most also let you switch to another flight or get a free refund when the schedule changes or a flight is cancelled. That leads to a game, especially when you can cancel tickets for little to no penalty if your game doesn’t work:
When you’re booking travel far out and your preferred date and time costs too much, book a flight that will likely have a schedule change so that you can switch to the expensive, ideal flight instead.
The Mechanics
How do you know which flights are most likely to have a schedule change? Look at both current flights and historical flights on a site like FlightRadar24 or FlightAware to see what an airline usually flies, then look for flights in the future with different schedules. Alternatively, take a look at what they’re selling in the near future and extrapolate.
For example, let’s say you want to fly from Salt Lake City, UT to Boise, ID on a Sunday. Currently, scheduled non-stop flights on Delta for Sundays in July leave at:
8:06 AM
11:00 AM
3:45 PM
10:50 PM
In Spring of 2025, the schedule looks almost the same:
8:45 AM
11:00 AM
3:35 PM
5:54 PM
11:00 PM
But, the schedule has a smoking gun – that 5:54 PM flight doesn’t currently exist, and it probably won’t exist by the time Spring 2025 rolls around (#RemindMeOfThisPostIn2025). When that flight is inevitably cancelled, you’ll be able to switch to another day, a different flight on the same day, or if you’ve really got rizz, perhaps even switch to a different airport.
What Could go Wrong?
There are of course caveats:
Past performance doesn’t guarantee future results
Holidays mess up schedules
Football games and major concerts lead to one-off flights
Lubbock only has once daily frequencies
The best news is that you can probably play this game with three or four airlines at minimum, so you’ve got multiple shots at getting your way.
Good luck and happy Wednesday!
Honorary travel hacking shirt awarded only to those that can turn an SLC-BOI schedule change into an LAX-HNL flight.
Bank account and brokerage bonuses have been a staple of the churning diet since before churning was called churning. In the era of ZIRP (Zero Interest Rate Policy), sign-up bonuses of $200-$300 for moving $25,000 in funds to a bank for 90 days used to be no-brainer deals because if you had the cash uninvested anyway, you were earning an average of 0.10% interest in a savings account. Since America loves math, we can show in a simplified calculation that your nominal opportunity cost was barely enough for a Starbucks latte:
Opportunity Cost in ZIRP era (Savings): $6.15 $25,000 * 0.10% * 90 days / 365 days ≈ $2.46 (Why 365? Since APR, is, err per A)
Fast forward to our post-ZIRP dystopian present in which you can easily earn 5.00% or more in an FDIC insured account, and that bank bonus on a checking account that pays effectively zero has a very different opportunity cost
Opportunity Cost in the Facebook Meta Threads era (Savings): $308.20 $25,000 * 5.00% * 90 days / 365 days ≈ $308.20
What’s my point here? Obviously run the numbers before diving into a new bank account. But, you can also memorize a quick statistic for whether or not a bank account bonus is worth your time: You should earn somewhere around $50 for each 30 days that you tie up $10,000, or a high-yield savings account beats it.
Note: I know that the “but actually” people out there are going to point out that you’d earn a few cents more at most bank accounts because of compounding and monthly payouts, and that 5% of $10,000 for 30 days is more like $41 dollars. Let’s just say “you’re not wrong” and leave it at that.
A churner dresses up as a number, preparing to run.
Very few companies have a monolithic technology stack. That means you’ll often find different behavior with:
Mobile apps versus a website
Older terminal hardware versus newer hardware
Android apps versus iOS apps
Version 1.0 versus version 1.1
Ok cool. How about a few specific examples?
FlyingBlue will show different pricing and availability on AirFrance’s site than KLM’s
Turkish Airlines fails to ticket some itineraries on desktop, but they’re easily bookable in the app
Older Walmart terminals behave differently than newer terminals
Some Kroger registers auto-drain cards, others won’t
Old school bill payment platforms charge different fees based on what you use to start a payment
Ok, cool again. Now why should you care?
Different technologies get different results, which leads to conflicting data points. Not all conflicts are easily explained by different technology stacks, but a surprising number are
Fees, funding methods, and functionality often differ. Can’t get that payment to go through on the desktop? Maybe hit up the mobile app. Mobile app doesn’t work? How about the prior version?
Let’s say you’re trying to get home to Los Angeles from Munich in a premium cabin, and the cheapest award flight:
MUC-FRA-LAX: 155,000 United MileagePlus miles
One of the simplest easy ways to access much more business and first class international award inventory and save miles in the process is to book a positioning flight, where you fly to another airport on one ticket and then start your award travel itinerary. For example, you might find:
MUC-AMS: 4,500 Virgin Atlantic points
AMS-LAX: 60,000 FlyingBlue points
At the surface level, 60,000+4,500 points for the second itinerary is much less than 155,000 miles for the first itinerary. But as you dig deeper, the second one has its own set of issues that might mean the savings isn’t worth it because you’re on two separate itineraries, which means:
You’re on your own if you misconnect
You can’t check your bags all the way from Munich to LAX
Schedule changes on one airline might torpedo your whole trip
There’s probably not opportunity to route around weather events
Any of those things could mean you lose out on that 60,000 point redemption, and you’ll end up trying to find a last minute ticket to LAX that costs quite a bit more.
The wisdom? Sometimes it’s cheaper to spend 155,000 points than it is to spend 64,500 points, but sometimes it’s not.
– Lowes: 3% cash back or 3x Membership Rewards – Food Lion: 1% cash back or 1x Membership Rewards
Neither offer lists a maximum transaction size, and both offers have to be re-added to your card an hour after use. Both expire in 75 days, and both stack well with the current typhoon of Citi Shop Your Way Rewards spend bonuses. (Thanks to Doug)
There’s good availability in economy for 15,000 miles each way out of all of these cities, and there’s some spotty business class availability from Minneapolis for 50,000 miles this summer. Unfortunately for everyone involved, summer is about the only time that Minneapolis has better weather than much of Europe.
Chase’s increased Sapphire Preferred and Sapphire Reserve sign-up bonuses became available in branch on Sunday, and they’re available online now too:
– Sapphire Preferred: 75,000 bonus points after $4,000 spend in 3 months – Sapphire Reserve: 75,000 bonus points after $4,000 spend in 3 months
Neither is available via referral yet, but I’d wait a week or two if timing isn’t critical because they’ll likely soon be available for a referral bonus too. You could get both with a Modified Double Dip, but I’d strongly prefer pairing a Sapphire Reserve with an Ink Preferred for more net points and better cash-out options.
First, let’s look look at the 90th and 95th percentile for arrival delays by marketing carrier (or, in other words, how many minutes past scheduled arrival captures 90% or 95% of all carrier arrivals)? Note that this includes regional jets operated by partner airlines like SkyWest, Endeavor, and United Express.
Marketing Carrier
90th Percentile Arrival Delay (minutes)
95th Percentile Arrival Delay (minutes)
American Airlines
51
83
Alaska Airlines
31
53
JetBlue
83
138
Delta
31
63
Frontier
73
120
Hawaiian
34
54
Spirit
66
113
United
43
85
Southwest
36
62
2023 Arrival statistics by marketing carrier.
I’m most surprised by JetBlue here, given that to have a 95% chance of arriving in time for your connection, you need to pad your connection time by nearly 2 hours and 20 minutes. On the other hand, I wrote this on a JetBlue flight that was delayed by about 3 ½ hours, so I guess confirmed? Well played JetBlue.
Operating Carrier Arrival Stats
Now, let’s look at the same thing for major airlines flying mainline aircraft, excluding any regional jets, since often we’re able to avoid regional jets for positioning flights or connections and historically they don’t perform as well:
Marketing Carrier
90th Percentile Arrival Delay (minutes)
95th Percentile Arrival Delay (minutes)
AA
51
97
Alaska
31
55
JetBlue
83
138
Delta
31
66
Frontier
73
120
Hawaiian
34
54
Spirit
66
113
United
43
85
Southwest
36
62
2023 Arrival statistics by operating carrier, major airlines.
Note that AA’s operation has worse (!) performance when its regional partner airlines are excluded from the statistics and we only consider mainline flights. I had to go triple check this data because wow, that sucks AA.
What about data for the regionals only, when they’re operating on behalf of one of the majors?
Marketing Carrier
90th Percentile Arrival Delay (minutes)
95th Percentile Arrival Delay (minutes)
Endeavor
27
63
CommuteAir
36
82
GoJet
40
80
Envoy
32
62
PSA
32
70
SkyWest
32
70
Piedmont
25
62
Horizon
22
45
Mesa
68
129
Republic
23
53
Air Wisconsin
61
114
2023 Arrival statistics by operating carrier, regional airlines operating for another carrier.
My mental model for regional jet carriers is usually: avoid GoJet and Mesa, SkyWest is most likely to get you there. The data proves that’s only somewhat correct for 2023 though.
Major Hub Arrival Statistics
Ok, but what about a given hub? We all know that some function better than others, so let’s look at arrival delays at the top 15 airports by total number of commercial flights, plus one bonus airport.
Airport
90th Percentile Arrival Delay (minutes)
95th Percentile Arrival Delay (minutes)
ATL
33
71
DEN
44
86
ORD
41
86
DFW
46
94
CLT
38
83
LAX
39
74
LAS
50
85
SEA
27
53
PHX
37
70
LGA
43
85
MCO
63
109
IAH
44
92
EWR
48
93
DCA
36
73
BOS
56
102
SFO
47
84
JFK
56
107
LBB
44
81
2023 Arrival statistics by airport, ordered by total number of air carrier flights in 2023.
So I guess avoid positioning flights to Orlando, Boston, or JFK if you can help it.
Also for fun, these are the worst airports for delays:
Airport
90th Percentile Arrival Delay (minutes)
95th Percentile Arrival Delay (minutes)
PVU
87
160
PSE
93
152
BQN
86
137
SFB
73
130
TTN
83
129
2023 Arrival statistics by airport, ordered by biggest 95th percentile arrival delays.
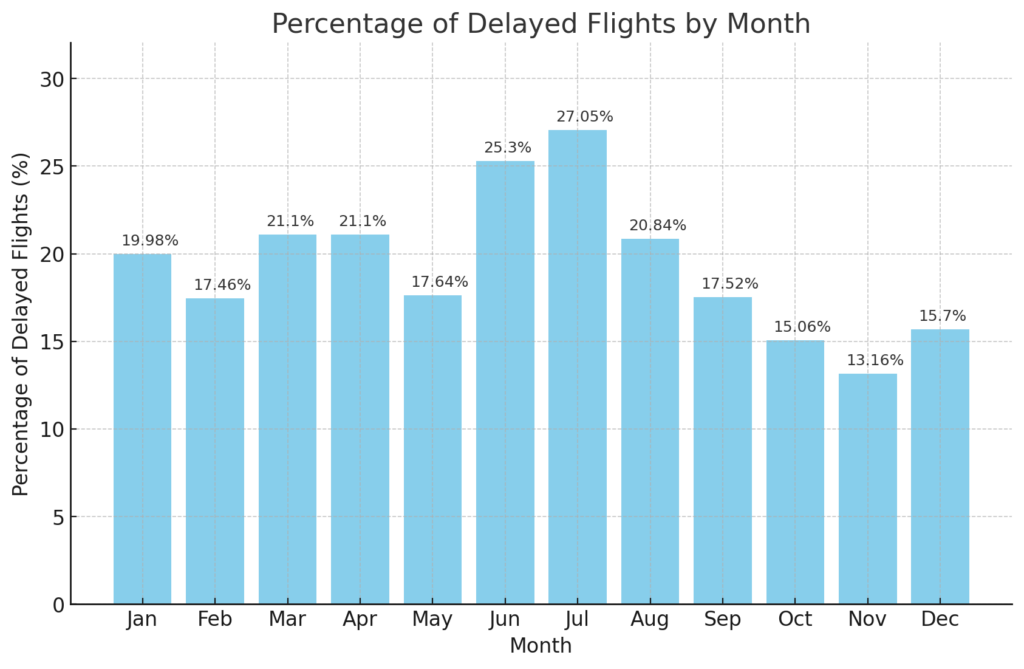
We can dissect this data in a million different ways, but we know winter storms make things worse and summer thunderstorms don’t help either. So let’s look at when you’re most likely to be delayed, by month.
So, build extra time in for positioning flights in June and July.
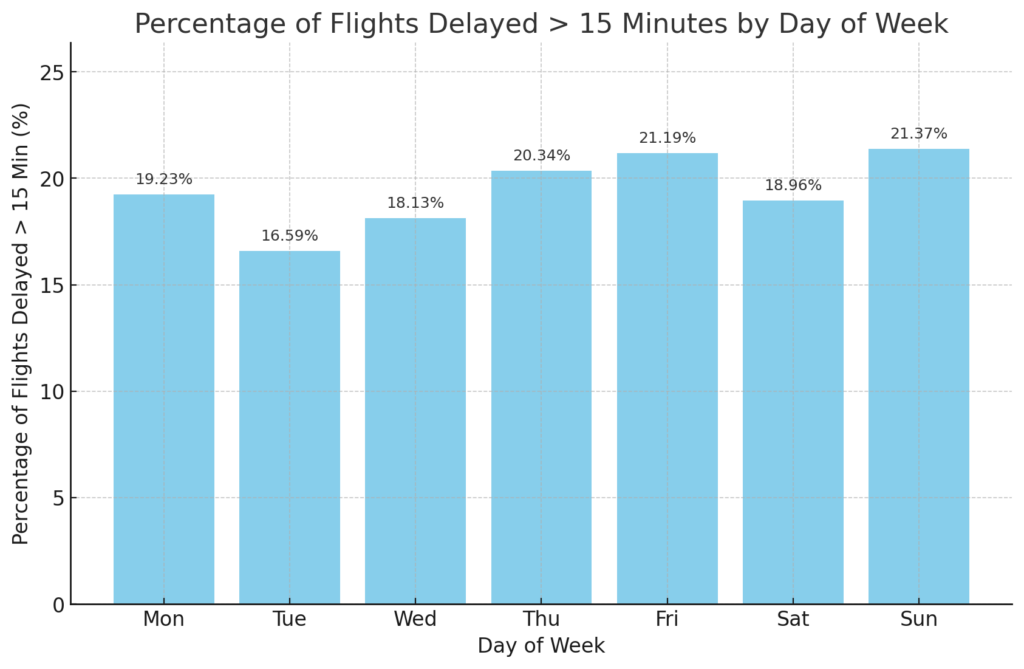
What about breaking this down by day of the week?
The takeaway here is probably that the day of week doesn’t matter much, unless it’s Tuesday.
Conclusion
If you’re interested in seeing the raw CSV data (which ended up in an SQL database), let me know, I’m happy to share. Otherwise, good luck on those award flights!
Avianca has a quirky award chart with plenty of hacks, but my favorite easy hack is to tack an economy flight on to the end of a one way itinerary to make the whole thing price lower. (Thanks to TheSultan1)
Note that if you have to cancel one of these tickets because reasons, Virgin Atlantic can be hard to deal with and may require multiple phone calls to chase it down. (Thanks to TeddyH)
Kroger stores have a 4x fuel points promotion running tomorrow through April 2 on third party gift cards. If you use this as an opportunity for AmEx manufactured spend, find a way to separate your purchases from even dollar amounts, especially those around $500, $1,000, etc. (Thanks to Will)
EDITORS NOTE: In 2024, I’m going to try and have a guest post on Saturdays. Today’s guest post is from the strong analytical mind of MattD (maybe the D stands for doppelgänger? Probably not).
Alaska plans to introduce their new award chart in March. Since joining OneWorld this was expected to happen as Alaska tries to become a global airline without any routes leaving the Americas.
Still, I have been keen on earning Alaska miles when an opportunity or safe way presents itself. I looked back on previous Alaska award bookings and all but one were flights to Asia. I will show below why I’m still earning Alaska miles and for this example, I chose Bangkok, Thailand as my comparison point.
Below in Table 1, we will examine the old price of routes along with the new pricing with percentage increase. At first glance, the numbers look gnarly and all hope should be abandoned.
Table 1: Old Alaska Award Chart vs New with Percent Difference for a Business Class Flight to Bangkok
Airline
Old Price
New Price
SEA/YVR
LAX
DFW
ORD
JFK
Cathay
50,000
85,000 (+70%)
85,000 (+70%)
85,000 (+70%)
85,000 (+70%)
Hainan
50,000
85,000 (+70%)
JAL
60,000
85,000 (42%)
85,000 (42%)
85,000 (42%)
85,000 (42%)
85,000 (42%)
Emirates
105,000
130,000 (24%)
130,000 (24%)
130,000 (24%)
130,000 (24%)
85,000 (-19%)
Singapore
100,000
85,000 (-15%)
85,000 (-15%)
13,0000 (30%)
13,0000 (30%)
13,0000 (30%)
Removed Finnair because there’s no reason to fly out of the way unless there’s a bar onboard to post a picture of.)
40,000 was used as the old standard credit card sign-up bonus and 65,000 was used as the new standard credit card sign-up bonus, which is a 62.5% increase in miles earned.
Obviously, the Cathay sweet spot is dead and will rest in its forever home with 100,000 Emirates First Class.
Alaska awards are only getting more expensive if the miles are earned from flying/organic credit card spend. But, the inflation in Alaska credit card bonuses since 2020 means most of these routes increased less than 10%. In fact many have become cheaper if you’ve earned your miles from well-timed sign up bonuses. Table 2 shows the old and new award chart looking at how many sign up bonuses it would take to buy a business class ticket to Bangkok.
Table 2: Alaska Sign Up Bonuses Needed for a Business Class Ticket
Airline
Old Price
New Price
SEA/YVR
LAX
DFW
ORD
JFK
Cathay
1.25
1.31
1.31
1.31
1.31
Hainan
1.25
1.31
JAL
1.50
1.31
1.31
1.31
1.31
1.31
Emirates
2.63
2.00
2.00
2.00
2.00
1.31
Singapore
2.50
1.31
1.31
2.00
2.00
2.00
Color coded to show which award increased vs decreased measured in sign up bonuses
While the new award chart has closed some sweet spots, new ones have opened up, like flying a beach towel in business class can now be had for 50,000 miles or 80% of a sign up bonus.
This won’t last forever as Alaska will keep devaluing enhancing their program faster than the credit card bonus increases. In the meantime though I will keep earning and burning Alaska miles.