The Bureau of Transportation Statistics has now released on-time data for all months in 2023, which means I get to play data geek, specifically with an eye toward positioning flights and how much time to build in to connections to have a great chance of everything working out, at least as long as this year is like data from 2023.
Marketing Carrier Arrival Stats
First, let’s look look at the 90th and 95th percentile for arrival delays by marketing carrier (or, in other words, how many minutes past scheduled arrival captures 90% or 95% of all carrier arrivals)? Note that this includes regional jets operated by partner airlines like SkyWest, Endeavor, and United Express.
| Marketing Carrier | 90th Percentile Arrival Delay (minutes) | 95th Percentile Arrival Delay (minutes) |
|---|---|---|
| American Airlines | 51 | 83 |
| Alaska Airlines | 31 | 53 |
| JetBlue | 83 | 138 |
| Delta | 31 | 63 |
| Frontier | 73 | 120 |
| Hawaiian | 34 | 54 |
| Spirit | 66 | 113 |
| United | 43 | 85 |
| Southwest | 36 | 62 |
I’m most surprised by JetBlue here, given that to have a 95% chance of arriving in time for your connection, you need to pad your connection time by nearly 2 hours and 20 minutes. On the other hand, I wrote this on a JetBlue flight that was delayed by about 3 ½ hours, so I guess confirmed? Well played JetBlue.
Operating Carrier Arrival Stats
Now, let’s look at the same thing for major airlines flying mainline aircraft, excluding any regional jets, since often we’re able to avoid regional jets for positioning flights or connections and historically they don’t perform as well:
| Marketing Carrier | 90th Percentile Arrival Delay (minutes) | 95th Percentile Arrival Delay (minutes) |
|---|---|---|
| AA | 51 | 97 |
| Alaska | 31 | 55 |
| JetBlue | 83 | 138 |
| Delta | 31 | 66 |
| Frontier | 73 | 120 |
| Hawaiian | 34 | 54 |
| Spirit | 66 | 113 |
| United | 43 | 85 |
| Southwest | 36 | 62 |
Note that AA’s operation has worse (!) performance when its regional partner airlines are excluded from the statistics and we only consider mainline flights. I had to go triple check this data because wow, that sucks AA.
What about data for the regionals only, when they’re operating on behalf of one of the majors?
| Marketing Carrier | 90th Percentile Arrival Delay (minutes) | 95th Percentile Arrival Delay (minutes) |
|---|---|---|
| Endeavor | 27 | 63 |
| CommuteAir | 36 | 82 |
| GoJet | 40 | 80 |
| Envoy | 32 | 62 |
| PSA | 32 | 70 |
| SkyWest | 32 | 70 |
| Piedmont | 25 | 62 |
| Horizon | 22 | 45 |
| Mesa | 68 | 129 |
| Republic | 23 | 53 |
| Air Wisconsin | 61 | 114 |
My mental model for regional jet carriers is usually: avoid GoJet and Mesa, SkyWest is most likely to get you there. The data proves that’s only somewhat correct for 2023 though.
Major Hub Arrival Statistics
Ok, but what about a given hub? We all know that some function better than others, so let’s look at arrival delays at the top 15 airports by total number of commercial flights, plus one bonus airport.
| Airport | 90th Percentile Arrival Delay (minutes) | 95th Percentile Arrival Delay (minutes) |
|---|---|---|
| ATL | 33 | 71 |
| DEN | 44 | 86 |
| ORD | 41 | 86 |
| DFW | 46 | 94 |
| CLT | 38 | 83 |
| LAX | 39 | 74 |
| LAS | 50 | 85 |
| SEA | 27 | 53 |
| PHX | 37 | 70 |
| LGA | 43 | 85 |
| MCO | 63 | 109 |
| IAH | 44 | 92 |
| EWR | 48 | 93 |
| DCA | 36 | 73 |
| BOS | 56 | 102 |
| SFO | 47 | 84 |
| JFK | 56 | 107 |
| LBB | 44 | 81 |
So I guess avoid positioning flights to Orlando, Boston, or JFK if you can help it.
Also for fun, these are the worst airports for delays:
| Airport | 90th Percentile Arrival Delay (minutes) | 95th Percentile Arrival Delay (minutes) |
|---|---|---|
| PVU | 87 | 160 |
| PSE | 93 | 152 |
| BQN | 86 | 137 |
| SFB | 73 | 130 |
| TTN | 83 | 129 |
So, don’t expect to fly to Provo, UT in any timely fashion. Maybe the late arrivals explain why Provo, part of what’s affectionally called “Happy Valley”, is the number one spot in the nation for anti-depressant prescriptions per capita.
By Season
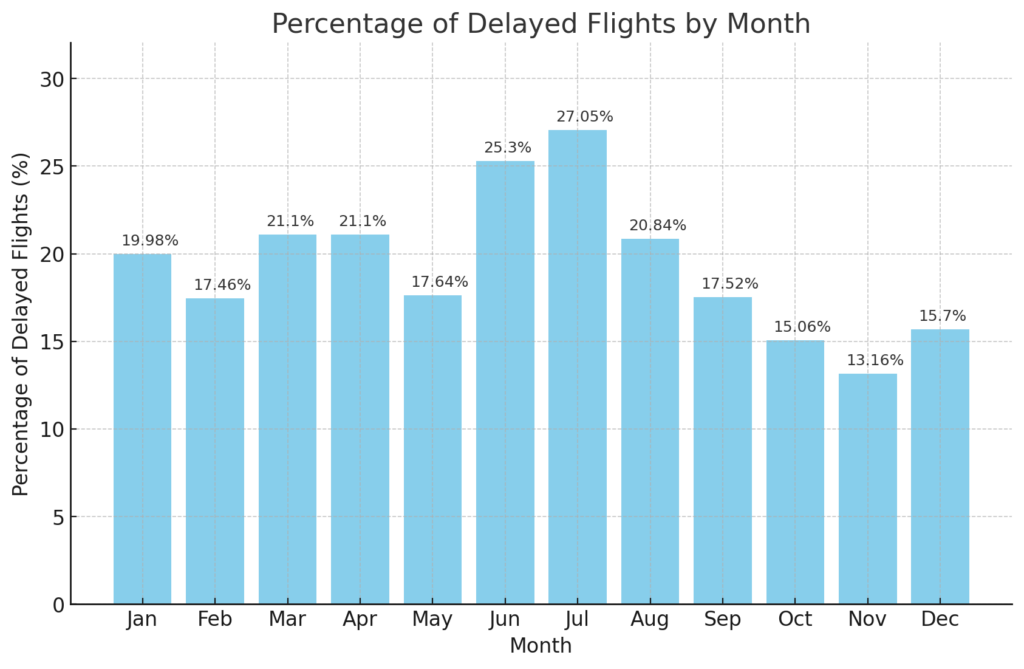
We can dissect this data in a million different ways, but we know winter storms make things worse and summer thunderstorms don’t help either. So let’s look at when you’re most likely to be delayed, by month.

So, build extra time in for positioning flights in June and July.
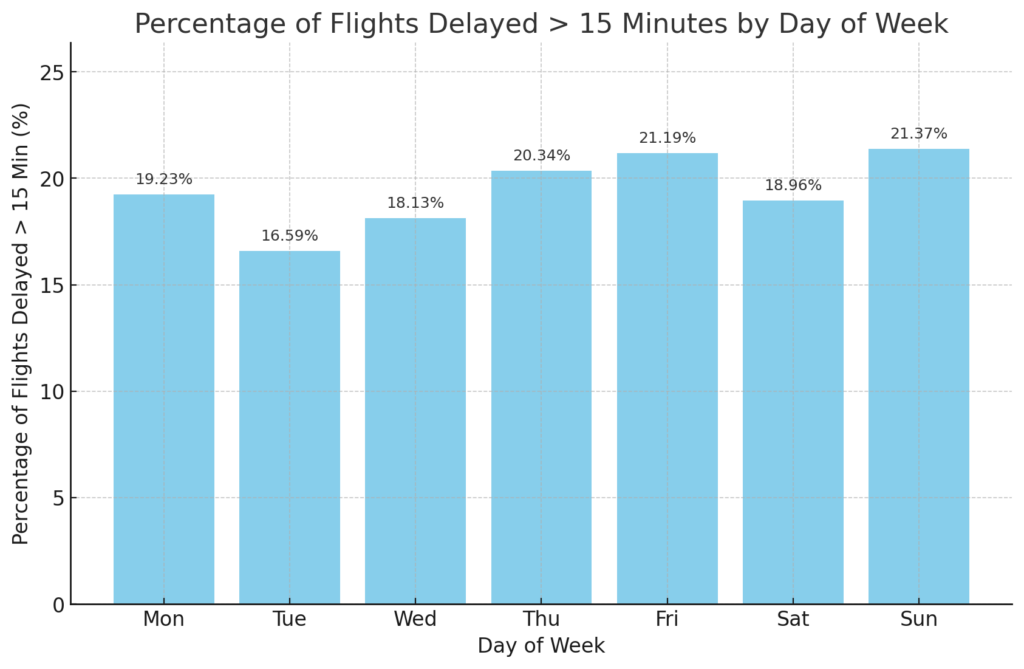
What about breaking this down by day of the week?

The takeaway here is probably that the day of week doesn’t matter much, unless it’s Tuesday.
Conclusion
If you’re interested in seeing the raw CSV data (which ended up in an SQL database), let me know, I’m happy to share. Otherwise, good luck on those award flights!

MEAB today, prolly.